Loading…
 Chicago Bears
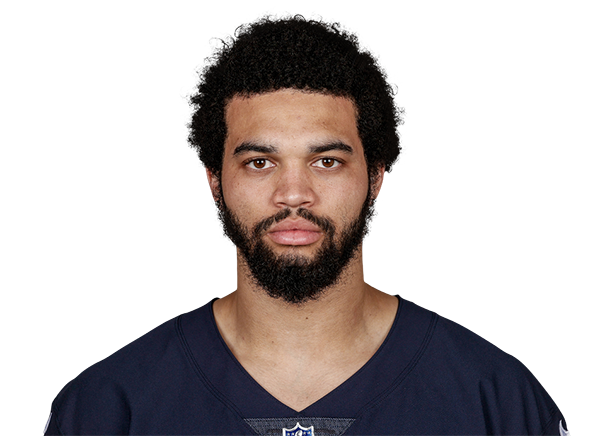
Caleb Williams
#18 · QB · 6' 1" · 226 lb · 5 games
Stats updated: Nov 2, 2026 — nightly box scores, not live.
- Draft
- Undrafted
- College
- USC
- Experience
- 4 seasons
Line
Passing Yards · season avg 253.4 PASS YDS · our lineSave this PrizePicks prop to your Playbook to track it
OutOutCaleb Williams isn't expected to play — the read below describes past games only.
Williams helped set the tone for the Bears' statement road victory by leading a 17-play, 80-yard march that absorbed 8:32 of the first quarter, one that the third-year signal-caller capped off with a one-yard touchdown pass to Luther Burden. Williams then managed the game effectively from that point forward, avoiding mistakes while leaning on a workhorse performance from D'Andre Swift (27 carries, three touchdowns) and an often dominating effort from his defense. Williams now has a three-game streak of interception-free performances and is up to 1,267 passing yards through five contests heading into a Week 9 home matchup against the Buccaneers on Sunday night.
Verdict
vs 268.5 PASS YDSPassing YardsNo readFireFactor 0/100· model 47% over
Hit rate (confidence-adjusted)79supports it
Projection vs line47neutral
Consistency59neutral
Projection
257.0 PASS YDS
L5 253.4 · L10 253.4 · med 269.0
Consistency
Steady
floor 225.2 · ceil 305.6
Matchup
NR
small sample
Player is Out — no read on this line.Small samples and hot streaks are discounted by a 95% Wilson lower bound (the trust factor), so a thin streak can’t masquerade as an edge.
Book links are referral links — we may earn a commission. It never affects the numbers on this page.
Last 55 games
60%over
3 over · 2 under
Low confidence95% CI 23%–88%Last 105 games
60%over
3 over · 2 under
Low confidence95% CI 23%–88%Last 205 games
60%over
3 over · 2 under
Low confidence95% CI 23%–88%Season5 games
60%over
3 over · 2 under
Low confidence95% CI 23%–88%Alternate lines — Passing Yards (PASS YDS)
PASS YDS over rate across nearby lines (season) — find where the edge holds or flips. The bar shows the 95% Wilson interval; the dot is the point estimate. Click a line to run the full read at that number.
| Line | Over | O / U | Confidence interval |
|---|---|---|---|
| 60% | 3/5 | ||
| 60% | 3/5 | ||
| 60% | 3/5 | ||
| 268.5Current | 60% | 3/5 | |
| 40% | 2/5 | ||
| 40% | 2/5 | ||
| 40% | 2/5 |
Situational splits
Over 268.5 PASS YDS by situation, each with its own confidence — thin splits read Low, so a small-sample “crushes at home” doesn’t masquerade as an edge.
Home / Away
Home50%1/2Low
Away67%2/3Low
Days since last game
3+ days50%2/4Low
 Next matchup — vs TB
Nov 9, 2026
23rdof 32 in PASS YDS allowed to quarterbacks
TB allows 214.3 PASS YDS per game to quarterbacks (rank 1 = allows the most).
Sample: 8 player-gameslow sample — interpret with caution
ToughThe read
Over his last 5 games, Caleb Williams has gone over 268.5 PASS YDS 3 of 5 decided times (60%) — versus 60% across the full season. TB has been a tough matchup for quarterbacks this season, allowing the 23rd-most PASS YDS of 32 teams (214.3 per game) (small sample — read with caution). His game-to-game PASS YDS have been fairly steady (σ ≈ 62.0), so short streaks can mislead. These are descriptive stats about past games, not predictions or betting advice.
Market edgeauto
4 books @ 243.5 PASS YDS- No-vig fair (over)
- 50.0%
- No-vig fair (under)
- 50.0%
Best Over
DraftKings-111
-5.0% EV
Best Under
DraftKings-113
-5.8% EV
Model vs market (over)-3.0%
Our model puts the over at 47.0% vs the market's no-vig 50.0%. A comparison of two numbers — not a guarantee.
Line shopping — Passing Yards (PASS YDS)
Each book’s line and your season over rate at that number, vs the market consensus (243.5 PASS YDS). A softer number you’d clear more often is a discount — the best one lifts the FireFactor read. Click a book to switch the whole read to it.
over rate = season hit rate at that line. Edge = points of hit rate vs the consensus line. Descriptive research from past games — not betting advice.
Fair-price calculator
Enter the book's American odds to see implied probability, the no-vig fair price, and the edge vs. this player's season hit rate.
Edge vs
Hit rate excludes pushes from the denominator. Confidence uses a 95% Wilson interval — a high recent rate on few games still reads as low confidence. Season over rate at this line: 60%.