Loading…
 Green Bay Packers
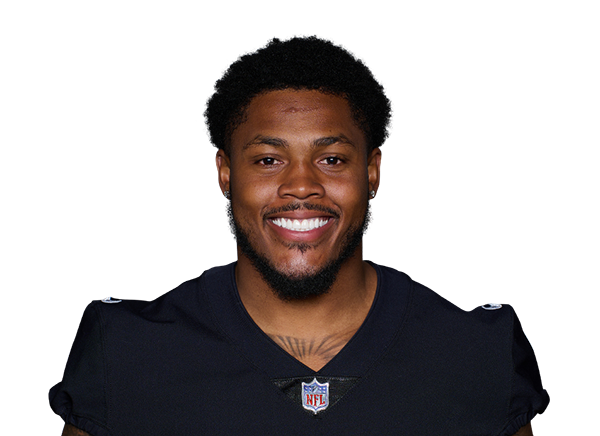
Josh Jacobs Receptions
Stats updated: Oct 29, 2026 — nightly box scores, not live.
Josh Jacobs has gone over 2.5 REC in 5 of his last 10 decided games (50%), measured against our typical-game line.
- Draft
- Undrafted
- College
- Alabama
- Experience
- 9 seasons
Line
Receptions · season avg 2.9 REC · our lineSave this PrizePicks prop to your Playbook to track it
QuestionableQuestionableConfirm Josh Jacobs's status before the game.
- Injury:
- Not Specified Finger Fracture
Head coach Matt LaFleur revealed the nature of Jacobs' injury after the game. Jacobs exited the win with what was initially deemed a hand injury. He was unable to return against the Patriots, but the Packers are hoping Jacobs will be available for Week 10 against the Vikings. If Jacobs can't go, Pierre Strong, Kaleb Johnson and possibly MarShawn Lloyd (knee) would be Green Bay's backfield options.
Verdict
vs 2.5 RECReceptionsNo readFireFactor 4/100· model 57% under
Hit rate (confidence-adjusted)51neutral
Projection vs line57neutral
Consistency0argues against it
Matchup100supports it
Projection
2.8 REC(×0.82 context)
L5 3.2 · L10 3.1 · med 2.5
Consistency
Boom-Bust
floor 1.0 · ceil 5.0
Matchup
F
defense vs role
Recent history runs under on this line. Descriptive research from past games — not betting advice. Questionable — confirm status before acting.Small samples and hot streaks are discounted by a 95% Wilson lower bound (the trust factor), so a thin streak can’t masquerade as an edge.
Book links are referral links — we may earn a commission. It never affects the numbers on this page.
Last 55 games
40%over
2 over · 3 under
Low confidence95% CI 12%–77%Last 1010 games
50%over
5 over · 5 under
Low confidence95% CI 24%–76%Last 2016 games
50%over
8 over · 8 under
Medium confidence95% CI 28%–72%Season16 games
50%over
8 over · 8 under
Medium confidence95% CI 28%–72%Alternate lines — Receptions (REC)
REC over rate across nearby lines (season) — find where the edge holds or flips. The bar shows the 95% Wilson interval; the dot is the point estimate. Click a line to run the full read at that number.
| Line | Over | O / U | Confidence interval |
|---|---|---|---|
| 94% | 15/16 | ||
| 69% | 11/16 | ||
| 2.5Current | 50% | 8/16 | |
| 44% | 7/16 | ||
| 31% | 5/16 | ||
| 6% | 1/16 |
Situational splits
Over 2.5 REC by situation, each with its own confidence — thin splits read Low, so a small-sample “crushes at home” doesn’t masquerade as an edge.
Home / Away
Home57%4/7Low
Away44%4/9Low
Days since last game
3+ days53%8/15Low
 Next matchup — vs MIN
Nov 15, 2026
30thof 32 in REC allowed to running backs
MIN allows 1.5 REC per game to running backs (rank 1 = allows the most).
Sample: 15 player-games
ToughThe read
Over his last 10 games, Josh Jacobs has gone over 2.5 REC 5 of 10 decided times (50%) — versus 50% across the full season. MIN has been a tough matchup for running backs this season, allowing the 30th-most REC of 32 teams (1.5 per game). His game-to-game REC have been highly variable (σ ≈ 1.9), so short streaks can mislead. These are descriptive stats about past games, not predictions or betting advice.
Market edgeauto
6 books @ 3.5 REC- No-vig fair (over)
- 48.1%
- No-vig fair (under)
- 51.9%
Best Over
BetMGM+105
-1.5% EV
Best Under
DraftKings-120
-4.8% EV
Model vs market (over)-4.9%
Our model puts the over at 43.2% vs the market's no-vig 48.1%. A comparison of two numbers — not a guarantee.
Line shopping — Receptions (REC)
Each book’s line and your season under rate at that number, vs the market consensus (3.5 REC). A softer number you’d clear more often is a discount — the best one lifts the FireFactor read. Click a book to switch the whole read to it.
under rate = season hit rate at that line. Edge = points of hit rate vs the consensus line. Descriptive research from past games — not betting advice.
Fair-price calculator
Enter the book's American odds to see implied probability, the no-vig fair price, and the edge vs. this player's season hit rate.
Edge vs
Hit rate excludes pushes from the denominator. Confidence uses a 95% Wilson interval — a high recent rate on few games still reads as low confidence. Season over rate at this line: 50%.
More Josh Jacobs research
Josh Jacobs — full profile→
Every stat, splits, chart, and matchup.
Jacobs Carries→
Carries hit rates and trends.
Jacobs Rushing TDs→
Rushing TDs hit rates and trends.
Jacobs Targets→
Targets hit rates and trends.
Jacobs Receiving Yards→
Receiving Yards hit rates and trends.
Defense vs Position→
Which opponents inflate or suppress this prop.
NFL Heat Check→
The strongest reads across the league.
Descriptive research from public game logs — hit rates describe past games and are not predictions, picks, or betting advice.