Loading…
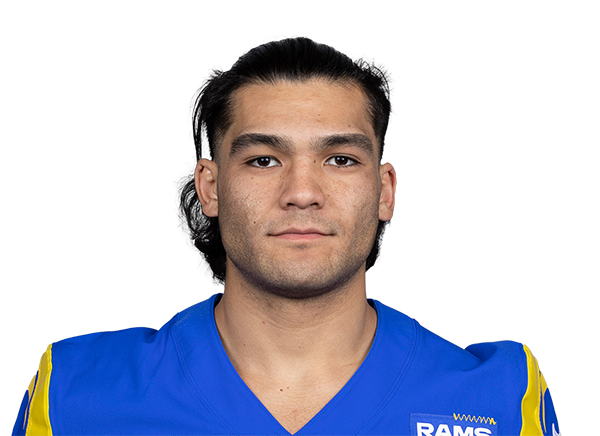
 Los Angeles Rams
Puka Nacua
#12 · WR · 6' 2" · 216 lb · 5 games
Stats updated: Nov 1, 2026 — nightly box scores, not live.
- Draft
- Undrafted
- College
- BYU
- Experience
- 5 seasons
Top reads — this player & matchup
pick one to load it belowRanked by FireFactor for the next matchup, straight from the game logs.
Line
Receiving Yards · season avg 97.0 REC YDS · our lineSave this PrizePicks prop to your Playbook to track it
QuestionableQuestionableConfirm Puka Nacua's status before the game.
- Injury:
- Not Specified Knee Not Specified
The Rams already are without WR Davante Adams for a few more weeks after he underwent surgery on his left hamstring, and the team now may be sans Nacua if the results of Monday's testing go a certain way. L.A. doesn't believe that Nacua sustained a torn ACL, but the MRI will reveal what type of damage he incurred. Before picking up the injury on the Rams' final offensive snap, Nacua gathered in 14 of 19 targets for 150 yards and one touchdown and took two carries for 20 yards.
Verdict
vs 80.5 REC YDSReceiving YardsNo readFireFactor 12/100· model 29% under
Hit rate (confidence-adjusted)79supports it
Projection vs line29argues against it
Consistency51neutral
Matchup50neutral
Projection
102.8 REC YDS(×1.08 context)
L5 97.0 · L10 97.0 · med 80.0
Consistency
Steady
floor 72.8 · ceil 127.6
Matchup
C
defense vs role
Recent history runs under on this line. Descriptive research from past games — not betting advice. Questionable — confirm status before acting.Small samples and hot streaks are discounted by a 95% Wilson lower bound (the trust factor), so a thin streak can’t masquerade as an edge.
Book links are referral links — we may earn a commission. It never affects the numbers on this page.
Last 55 games
40%over
2 over · 3 under
Low confidence95% CI 12%–77%Last 105 games
40%over
2 over · 3 under
Low confidence95% CI 12%–77%Last 205 games
40%over
2 over · 3 under
Low confidence95% CI 12%–77%Season5 games
40%over
2 over · 3 under
Low confidence95% CI 12%–77%Alternate lines — Receiving Yards (REC YDS)
REC YDS over rate across nearby lines (season) — find where the edge holds or flips. The bar shows the 95% Wilson interval; the dot is the point estimate. Click a line to run the full read at that number.
| Line | Over | O / U | Confidence interval |
|---|---|---|---|
| 60% | 3/5 | ||
| 60% | 3/5 | ||
| 60% | 3/5 | ||
| 80.5Current | 40% | 2/5 | |
| 40% | 2/5 | ||
| 40% | 2/5 | ||
| 40% | 2/5 |
Situational splits
Over 80.5 REC YDS by situation, each with its own confidence — thin splits read Low, so a small-sample “crushes at home” doesn’t masquerade as an edge.
Home / Away
Home33%1/3Low
Away50%1/2Low
Days since last game
3+ days50%2/4Low
 Next matchup — @ ARI
Nov 15, 2026
16thof 32 in REC YDS allowed to wide receivers
ARI allows 45.1 REC YDS per game to wide receivers (rank 1 = allows the most).
Sample: 25 player-games
NeutralThe read
Over his last 5 games, Puka Nacua has gone over 80.5 REC YDS 2 of 5 decided times (40%) — versus 40% across the full season. ARI has been a middling matchup for wide receivers this season, allowing the 16th-most REC YDS of 32 teams (45.1 per game). His game-to-game REC YDS have been moderately variable (σ ≈ 28.7), so short streaks can mislead. These are descriptive stats about past games, not predictions or betting advice.
Market edgeauto
3 books @ 92.5 REC YDS- No-vig fair (over)
- 50.0%
- No-vig fair (under)
- 50.0%
Best Over
BetMGM-115
-6.5% EV
Best Under
Caesars-112
-5.4% EV
Model vs market (over)+20.8%
Our model puts the over at 70.8% vs the market's no-vig 50.0%. A comparison of two numbers — not a guarantee.
Line shopping — Receiving Yards (REC YDS)
Each book’s line and your season under rate at that number, vs the market consensus (92.5 REC YDS). A softer number you’d clear more often is a discount — the best one lifts the FireFactor read. Click a book to switch the whole read to it.
under rate = season hit rate at that line. Edge = points of hit rate vs the consensus line. Descriptive research from past games — not betting advice.
Fair-price calculator
Enter the book's American odds to see implied probability, the no-vig fair price, and the edge vs. this player's season hit rate.
Edge vs
Hit rate excludes pushes from the denominator. Confidence uses a 95% Wilson interval — a high recent rate on few games still reads as low confidence. Season over rate at this line: 40%.